
Splunk vs Nagios
My company is evaluating splunk as main tool for support (log analysis) and monitoring. Since we are currently using nagios for monitoring, the question was to see if splunk could replace nagios or would rather supplement it.
Abstract
My company develops a product which is then installed at customer sites in a black box model: we deliver a rac with the hardware (a few linux servers and windows servers) and the software.
For monitoring our product we have a small Nagios set-up that checks the hardware and the services as well as a few business related checks (done via the ssh plugin). We have a quite good experience with Nagios for monitoring. Nagios is easy to set-up, it has a powerful file based configuration (which is important for versioning and deployment), there is a large amount of plugin to monitor every aspect of the infrastructure (memory usage, event logs, log files, etc.) It is also easy to do application/business monitoring with nagios: you can simply plug-in your shell script and let nagios execute the script (via ssh).
Nagios comes with a web based console in which you can see the state of all monitored component, where you can acknowledge problems, schedule new test, filter-out, etc. It is not super sexy but it is functional and does the job.
Splunk is a log analysis tool, it indexes whatever you tell him to index. It can be anything: log files of course, scripts output, database tables,..as long as it is time-based data. Afterwards you can quickly and easily build all kind of visualizations on the indexed data. It is easy to set-up and you also have a powerful file based configuration (you can also use a web interface, which is nice when you begin but you’ll get used to the files quickly).
So Splunk is not a replacement for Nagios but it can do part of what Nagios does. Based on indexed data it is possible to generate an alert (the alert is based on a search on the indexed data). With Splunk an alert means: put something in red on a dashboard and/or eventually send a mail or execute a script. Out of the box splunk lacks core functionality like acknowledging an alert (so that it stops firing and sending mails), filtering out a server or a group of services (typically during a planned downtime you would want to do that). It might be possible to work-around those limitations though, to some extent. This is what I experimented.
A second issue, which is not addressed here, is the case of a central set-up vs a distributed set-up and specifically the case where you need local monitoring on a client set-up but would like to also have a central view of all your clients. Note that this use case might not be completely relevant nor realistic.
With nagios I think you would collect the state changes on the local set-up and then, at specified interval or when a connection is available, send those state changes to the central console for consumption (via ssh, or via ftp ?). With splunk I guess one could let the local forwarders connect to the central instance but in reality there might be some challenges to address (like a burst of useless data being sent whenever the local sites catch up).
A monitoring console
Let’s keep the alerting part aside for the moment (I know this is where splunk will be limited compared to nagios) and let us try to build the same console as the nagios main service screen.
One of the main nagios web console screen shows all the services monitored, in green, red or yellow together with useful information (message, date, etc.)
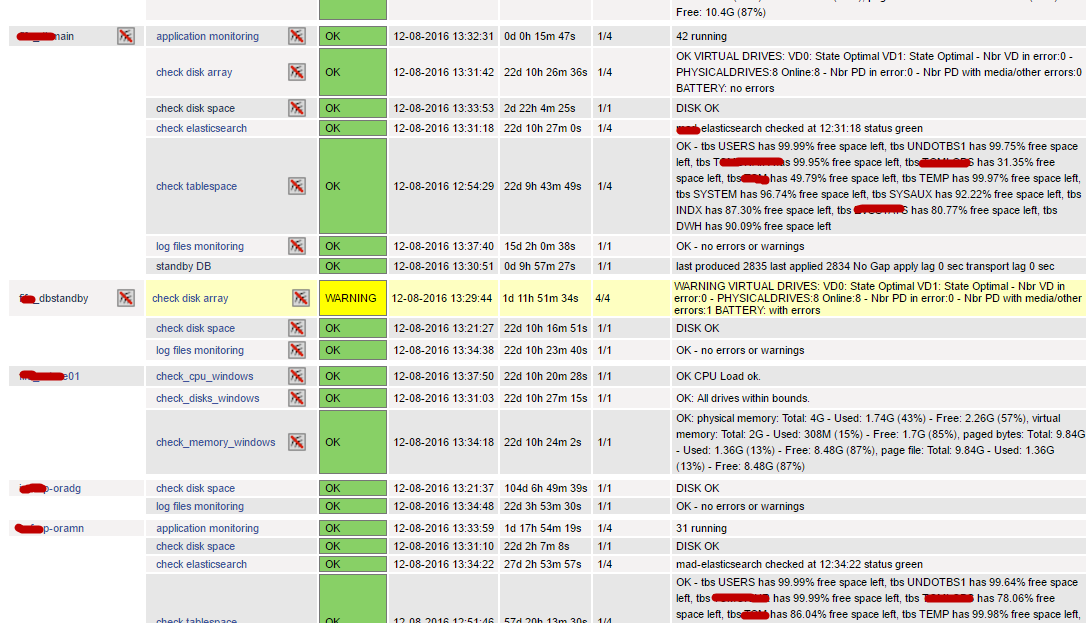
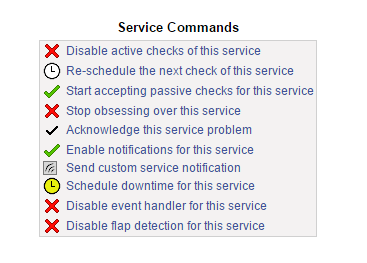
This main nagios screen shows the services and their state, but via this screen you can also acknowledge a problem (so that it stops firing notifications), you can disable checks on one host (all services on the host), or disable notifications, etc.
So a minimal requirement for a similar console in splunk would be to have a dashboard with a list of services - hostname couples with the last check date, the status (green, yellow, red) and a message. If a service did not give its state for more than interval (specific to each service/host) it should be displayed as error (in red).
With nagios, the checks are either provided by plugin or, for your own checks, you would typically distribute your scripts on the target servers and have the central nagios console executes those scripts at regular interval (based on the config).
But with splunk I feel it is more natural to do it the other way around: you deploy the scripts on the universal forwarders (like for nagios) amd it is the universal forwarders that will execute the scripts at scheduled interval and send the data to the central splunk instance (the indexer which is also the search head in our simple set-up). Basically splunk would function like a passive check in nagios (when the monitored application sends its state to nagios every x minutes as opposed to an active check where nagios actively monitor the target servers).
The splunk way feels more natural but of course it requires that the forwarders can connect to the central splunk instance while with nagios the requirement is that the central nagios server can connect to the local hosts (via ssh and/or via tcp on a specific port for monitoring the windows server).
A big difference also is that when nagios cannot execute a check, because a host is not responding for example, it can immediately turns the service check to red. With splunk, since the console (central server) is not actively monitoring, you must provide the logic to turn a service to red when no data has been received for too long.
Let’s go in the details of the splunk implementation. The following steps are required.
- install the central splunk (indexer + search, dashboards, reports, etc.)
- on each hosts to monitor, install the universal forwarders. Those hosts will be configured via files that can be distributed manually or via a deployment server (not tested though)
- on the central hosts, define the indexes and define the dashboard
I will not go in the detail of the install (easy and well documented), but I’ll put some info on the scripted inputs for the forwarder first and then some info on how I have build the dashboard on the central splunk server (as this was not so easy to do).
Splunk scripted input:
There are two strategies:
- Run a script at a regular interval that writes to a file and have splunk consume this file;
- Let the splunk forwarder execute a script at regular interval. The output of the script is captured by splunk and sent to the central indexer for indexing.
I tried option 2 since it is easy and because I can re-use the existing scripts (used for nagios).
Typically, on a forwarder where I want to monitor the megaraid disk array (for example) I will have
in the inputs.conf (on the forwarders, in /opt/splunkforwarder/etc/apps/
[script://./bin/megaraidcheck.sh]
disabled = 0
interval = 60
sourcetype = json
source = megaraid
index = myapp_service
the script itself is in /opt/splunkforwarder/etc/apps/
#!/bin/bash

NOW=`date --rfc-3339=ns`
STR=`/opt/nagios/megaRAIDcheck.sh`
ret=$?
if [ $ret -eq 0 ] ; then
 STATUS="green"
fi
if [ $ret -eq 1 ] ; then
 STATUS="yellow"
fi
if [ $ret -ge 2 ] ; then
 STATUS="red"
fi
cat <<EOF
 {"timestamp": "${NOW}", "status": "${STATUS}", "message": "${STR}"}
EOF
don’t forget to create the index
Splunk dashboard
On the dashboard, we want to see the last check for each service and color it appropriately (green, yellow, red). A difficulty here is that if one check did not happen or is too old (did not happen for more than the pre-defined interval), then it should appear in red. To solve this problem we need to store a configuration somewhere, splunk has the notion of a lookup csv file (could be a database table also).
On the server, create this csv file in /opt/splunk/etc/apps/myapp/lookups/ and call it
host,service,age,active,alerting
my-host-1,elasticsearch,60,1,0
my-host-1,megaraid,60,1,0
my-host-1,dataguard,300,1,1
my-host-1,san,60,1,0
my-host-1,appmonitor,120,1,0
my-host-1,tablespace,1800,1,0
my-host-2,elasticsearch,60,1,0
my-host-2,megaraid,60,1,0
... etc
In this csv the age column indicates the frequency of the check and the alerting column can be used to disable alerts for one service on one host.
based on the lookup table and the index myapp_service it is possible to display the information that corresponds more or less to the nagios dashboard.
The search query is a bit involved but splunk has a lot of good documentations and forums at your disposal to help you build almost any query. You need an outer join so that services that are not sending data for more than 2 hours (in my case, it depends on the biggest interval of all services monitored)
note: there cannot be a carriage return between the pipes, I added them to make the code readable but you have to remove them.
| inputlookup myapp_service | eval status="red", message="Missing data", service_check_age=0
| join type="outer" host,service [ search index=myapp_service earliest=-2h | dedup host,source
                                       | eval service=source ,last_check_seconds=ceil(now()-_time)
                                       | table _time service last_check_seconds host status timestamp message ]
| eval status=case(last_check_seconds>age,"red",1=1,status)
| table host service last_check_seconds status message
| rename last_check_seconds As "Last checked secs.", host as "Service_Hostname"
Adding alerting is very easy, you can have splunk send a mail and/or execute a custom script.
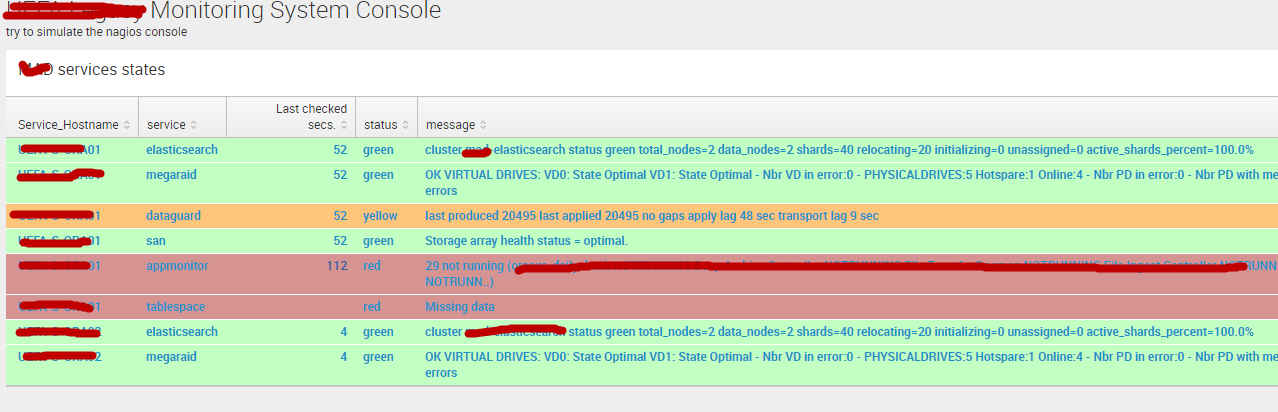
Here is a screen shot of the dashboard. Note that coloring the rows requires some work from a technical person (change some css on the server) and is not possible for an end-user. To do this row coloring you must install the sample dashboard app and look at their example (it took me a few hours to get it working as well as a few restart of splunk and emptying of my browser cache).
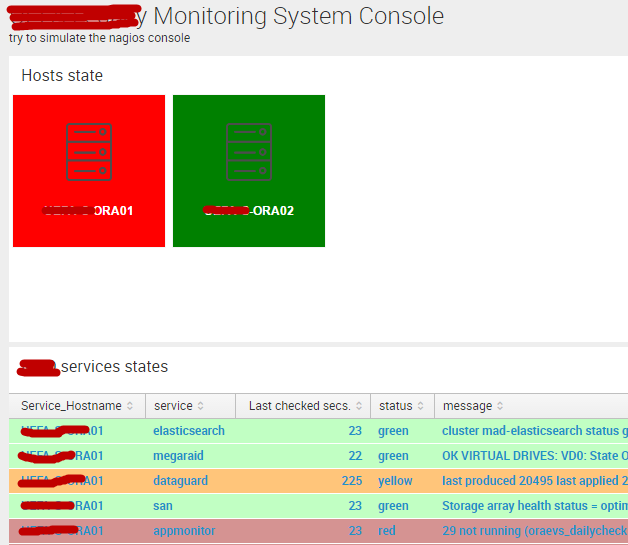
The product manager then wanted me to show a list of our servers colored in green if all services on this host are running fine, in red if one or more service is failed, in yellow if there is one service in warning. To do that, I used a vizualization called “Quick state” (you can donwload it freely): this vizualization requires tupples of the form label, img_url, color.
so first think, let’s take care of the image url: one has to install the png in the folder $SPLUNK_HOME/etc/apps/
The search query for this new dashboard panel is
| inputlookup myapp_service | eval status="red", message="Missing data", service_check_age=0 | join type="outer" host,service [ search index=myapp_service earliest=-2h | dedup host,source | eval service=source ,last_check_seconds=ceil(now()-_time) | table _time service last_check_seconds host status timestamp message ] | eval status=case(last_check_seconds>age,"red",1=1,status) | table host service last_check_seconds status message | stats count(eval(status="red")) as nbr_red, count(eval(status="yellow")) as nbr_yellow, count(eval(status="green")) as nbr_green by host | eval color=case(nbr_red>0,"red", nbr_yellow>0, "yellow", nbr_green>0,"green",1=1,"grey"), img_url="/static/app/myapp/server.png" | table host img_url color
What is lacking compared to nagios is the possibility to acknowledge an alert, stop monitoring one host, re-schedule a check, etc. With splunk you would have to manually edit the csv file (set alerting to 0, so that no alert is sent, or set active to 0, so that it does not show up on the dashboard). That’s the best work-around I have found. Probably it is possible to build interface so that an end-user could edit the csv file via the web interface (?).
Conclusion
For monitoring the infrastructure nagios is better than splunk because it has some core functionalities that splunk does not have in the area of alerting. Both comes with a lot of plugins so that your scripting skills will mostly be needed for applicative checks.
With Nagios you can acknowledge an alert (so that it stops firing), you can stop obsessing about a specific service or all services on a host or in a group, it is important in case of planned downtime for example. You can also base the notifications on the business calendar (no mails sent after 6PM or during w-e). With splunk it is not built-in the product, so you would have to work-around (the solution I came up with was creating a configuration file on the server).
Splunk is easy to get started with, very well documented and at the same time offers advanced discovery capabilities in your logs and any other source (as long as it is time based).
It did not take me long to build more or less the same console with splunk as nagios main console (list of services with their state). Splunk shines when it goes about creating dashboard, you have full access (via css) so that if you spend the time you will come up with very nice dashboard (which is not very relevant for infrastructure monitoring, I admit).
So if you can live with the alerting limitations I feel that splunk is good enough for the job (at least in the case of my application). And then of course you can do a lot more with splunk, it can replace cacti as well (for capacity management and performance monitoring). It has really great vizualisations tools so that you can make attractive dashboard very easily.
So not taking into account the price (nagios is 100% free), I think splunk is a very valuable addition to your toolset. It would rather complement nagios instead of replacing it though but there is some overlap.